The
Data Table appears at the bottom of the map section when you click the
![]() for a layer and select Data Table.
for a layer and select Data Table.
A sample data table appears below.
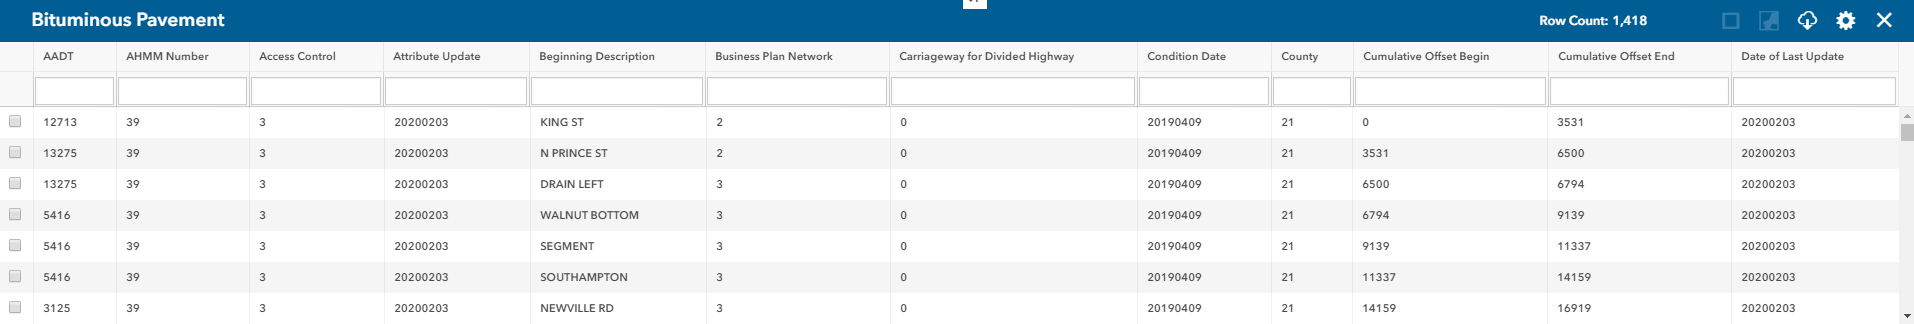
Each row represents a record in the data. In the sample above, each row shows data for a Bituminous Pavement.
Click a checkmark on the side of the table to select a row.
Tip: You can resize the data table to display more or fewer rows by clicking the top of the table (above the control buttons) and dragging up or down.
Each column contains a characteristic stored for individual crossings.
Tip: You can resize columns for ease of viewing by clicking the column border in the header and dragging left or right. PennDOT One Map will remember your customized settings.
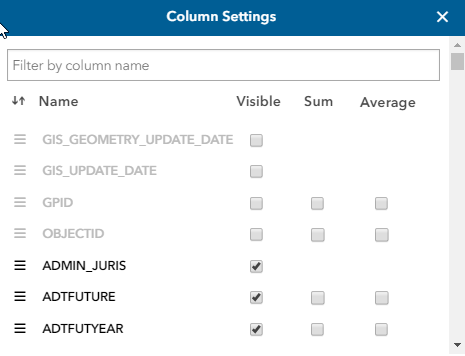
Column Settings - Click this link to display the Column Settings window, which contains a list of all available columns. Select the columns you want to display under Column is visible and click OK. Columns not selected will be hidden.
Row Count - Indicates total number of records retrieved.
 (Toggle Show
Selected) - Click this button to show only the selected records
on the table.
(Toggle Show
Selected) - Click this button to show only the selected records
on the table.
![]() (Map
Selected Features) - Click this button to map the records
selected on the table. On the map, the selected features appear highlighted
yellow.
(Map
Selected Features) - Click this button to map the records
selected on the table. On the map, the selected features appear highlighted
yellow.
 (Download Excel
Spreadsheet) - Click this button to create a Microsoft Excel
spreadsheet from the data contained in the data table.
(Download Excel
Spreadsheet) - Click this button to create a Microsoft Excel
spreadsheet from the data contained in the data table.
Note: If you have selected specific rows in the data table, only those selected results will be exported to the Excel spreadsheet.
 (Hide)
- Click this button at the top of the data table to hide it.
Click it again to show the table.
(Hide)
- Click this button at the top of the data table to hide it.
Click it again to show the table.
Click
the down arrow ![]() in any
column's heading to display a menu where you can select one of the following
actions:
in any
column's heading to display a menu where you can select one of the following
actions:
· Sort Ascending - Sorts the Data Grid list by the selected column in ascending order (A-Z , 1-9, etc.).
· Sort Descending - Sorts the Data Grid list by the selected column in ascending order (Z-A , 9-1, etc.).
Tip: You can also filter by a column value. Type into the text box below the column's heading to display only rows with matching results. Click here for an example.